HarmonyOS上的Flutter性能调优
适配HarmonyOS的Flutter应用程序可以使用Dart代码的DevTools进行调试。
*前提条件*
- OpenHarmony Next系统
- Flutter界面在前台运行
- 分析工具:
DevEco Studio Profiler
SmartPerf
*Flutter线程架构*
Flutter利用多个线程进行基本操作。所有Dart代码在UI线程上执行,这会影响其他线程:
- *平台线程*
插件代码运行的主平台线程
- *UI线程*
在Dart VM中执行Dart代码。处理:
- 开发者编写的代码
- 框架生成的代码
- 创建轻量级层树(设备无关的渲染命令)
- 将层树发送到GPU线程
*关键:* 永远不要阻塞此线程!在性能覆盖的底部栏中显示。
- *光栅线程(GPU线程)*
处理层树并发送到GPU。虽然无法直接交互:
- 运行缓慢表明Dart代码存在问题
- 托管Skia图形库
- 在性能覆盖的顶部栏中显示
- *I/O线程*
处理重的I/O操作,以防止阻塞UI/光栅线程。在性能覆盖中不显示。
- *RenderService线程*
RS进程的主线程。在Flutter渲染帧后:
- 纹理模式:与主线程合成(受主线程影响)
- 表面模式:直接显示(不受主线程影响)
*问题边界定义*
在DevEco Studio中:
1. 打开Profiler选项卡
2. 捕获应用程序跟踪
3. 关注`<x>.ui`、`<x>.raster`和RenderService主线程
上图中RenderService缺失的帧是由于UI线程每帧花费的时间过长,超过了一帧的时间(在120帧率下,一帧为8.33毫秒)。
如果<x>.ui和<x>.master在帧渲染过程中的总持续时间超过一帧时间,则可以将性能问题定义为Flutter问题。问题的定位需要进一步的性能分析。
查看原文
Flutter applications adapted for HarmonyOS can be debugged using DevTools for Dart code.<p>*Prerequisites*<p>- OpenHarmony Next system
- Flutter interface running in foreground
- Analysis tools:
DevEco Studio Profiler
SmartPerf<p>*Flutter Thread Architecture*
Flutter utilizes multiple threads for essential operations. All Dart code executes on the UI thread, which impacts other threads:<p>- *Platform Thread*
Main platform thread where plugin code runs
- *UI Thread*
Executes Dart code in Dart VM. Handles:
- Developer-written code
- Framework-generated code
- Creates lightweight layer trees (device-agnostic rendering commands)
- Sends layer trees to GPU thread
*Critical:* Never block this thread! Appears in performance overlay's bottom bar.
- *Raster Thread (GPU Thread)*
Processes layer trees and sends to GPU. While you can't directly interact:
- Slowness indicates Dart code issues
- Hosts Skia graphics library
- Appears in performance overlay's top bar
- *I/O Thread*
Handles heavy I/O operations to prevent blocking UI/raster threads. Not shown in performance overlay.
- *RenderService Thread*
RS process main thread. After Flutter renders frames:
- Texture mode: Composites with main thread (affected by main thread)
- Surface mode: Direct display (unaffected by main thread)<p>*Problem Boundary Definition*
In DevEco Studio:<p>1. Open Profiler tab
2. Capture application trace
3. Focus on `<x>.ui`, `<x>.raster`, and RenderService main threads<p>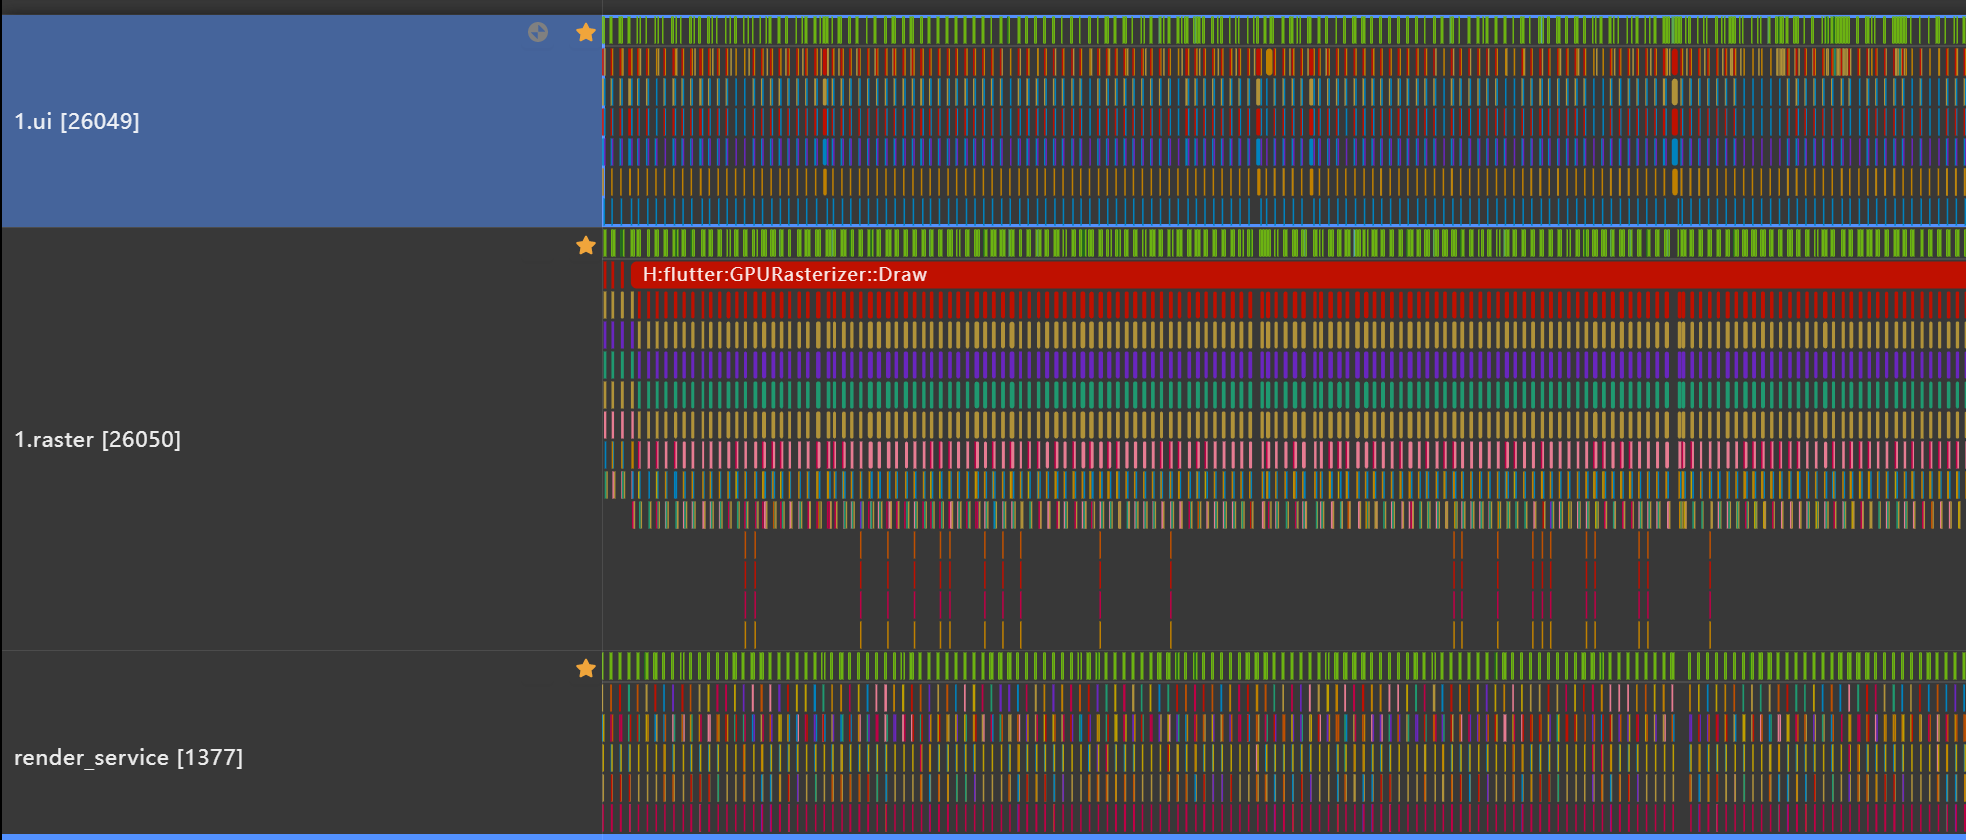<p>The missing frames in the RenderService in the above image are due to the UI thread taking a longer time per frame, exceeding one frame (at a frame rate of 120, one frame is 8.33 milliseconds).<p>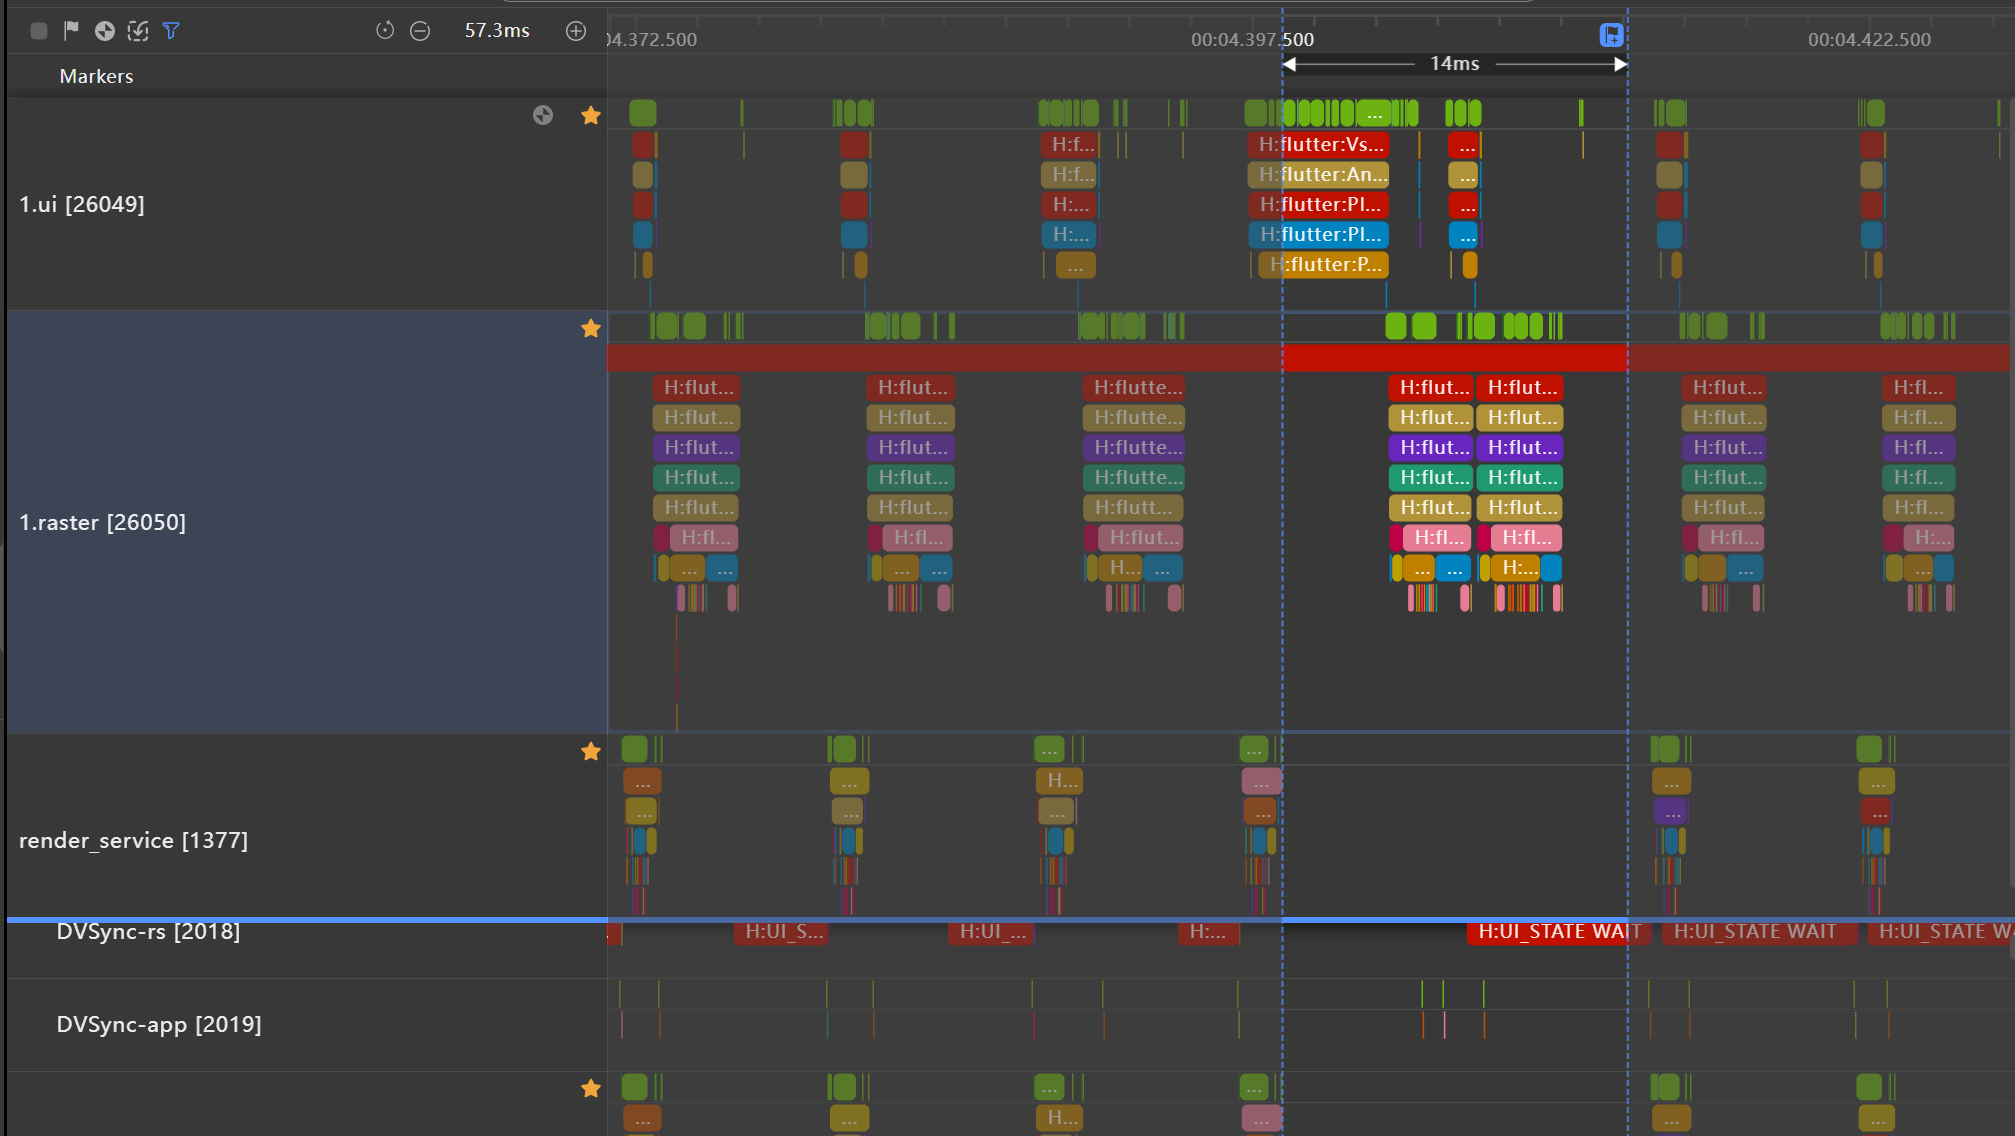<p>If the total duration of<x>. ui and<x>. master in a frame rendering process exceeds one frame time, the performance issue can be defined as Flutter problem. The positioning of the problem requires further performance analysis.